Getting started with Location Map
A 3-minute video guide on getting started with Maply and creating a heat map for US population.
Location Map
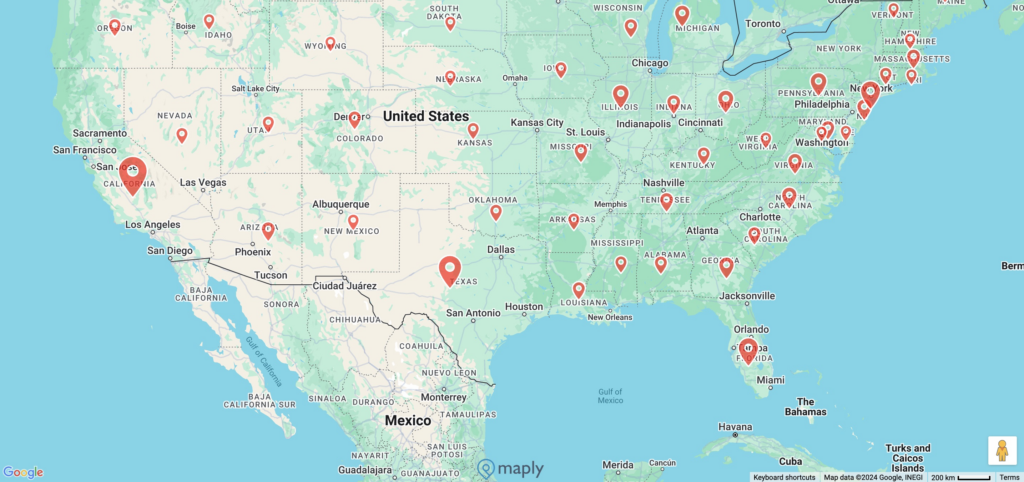
Location map is the most common type of maps and is also very often the starting point for location analytics or geospatial data analytics. Once a location map is created on Maply, you also get the heat map and cluster map automatically.
With Maply, mapping multiple locations becomes a breeze. You can add a location manually with address autocompletion or you can upload multiple locations.
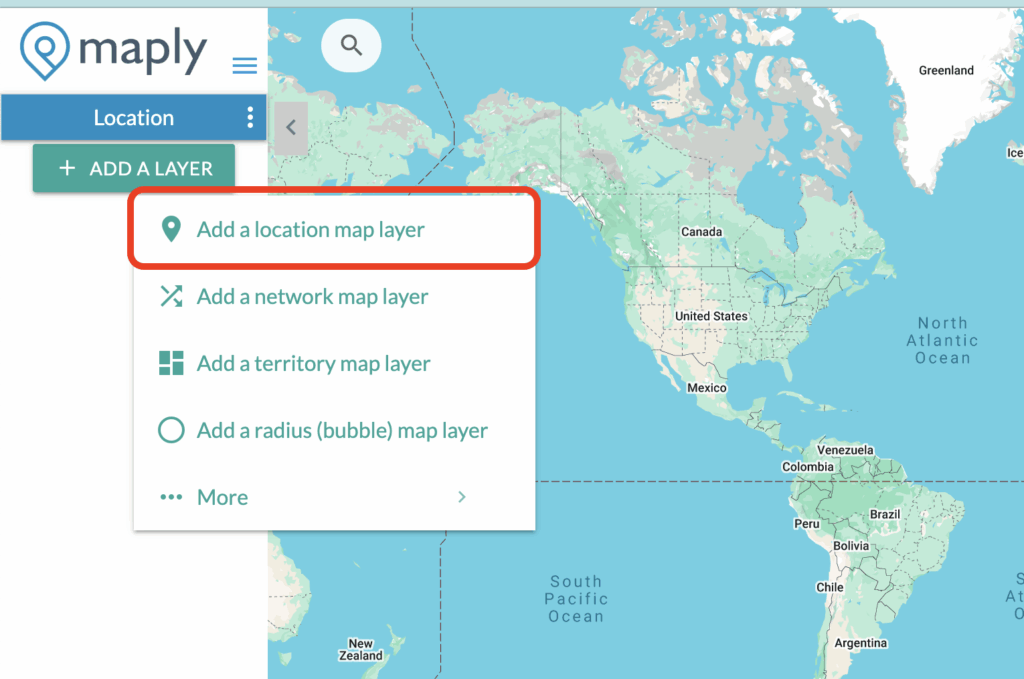
To upload multiple locations. Select “Add a Layer” and then “Add a location map layer” after creating a new map.
Smart Upload
With Smart Upload, now the default way of uploading locations, you can upload your location data directly from your existing datasets—no need to align with Maply’s standard template. The Smart Upload intelligently recognizes both location and non-location data, and processes them accordingly.
While Smart Upload is designed to be flexible and user-friendly, here are a few guidelines to ensure a smooth experience:
- Country Column Required
Your upload must include a country column. Without it, the upload will be rejected. - Column Limit
A maximum of 15 columns is allowed per upload. Please remove any excess columns before uploading. - Header Naming Matters
Column headers are used to identify and classify your data. Use clear and relevant names for best upload results. - Maximum file size: 5 MB
Larger files will be rejected. - Allowed formats: Excel (.xlsx, .xls), or CSV (.csv)
All other format will be rejected.

Copy & Paste
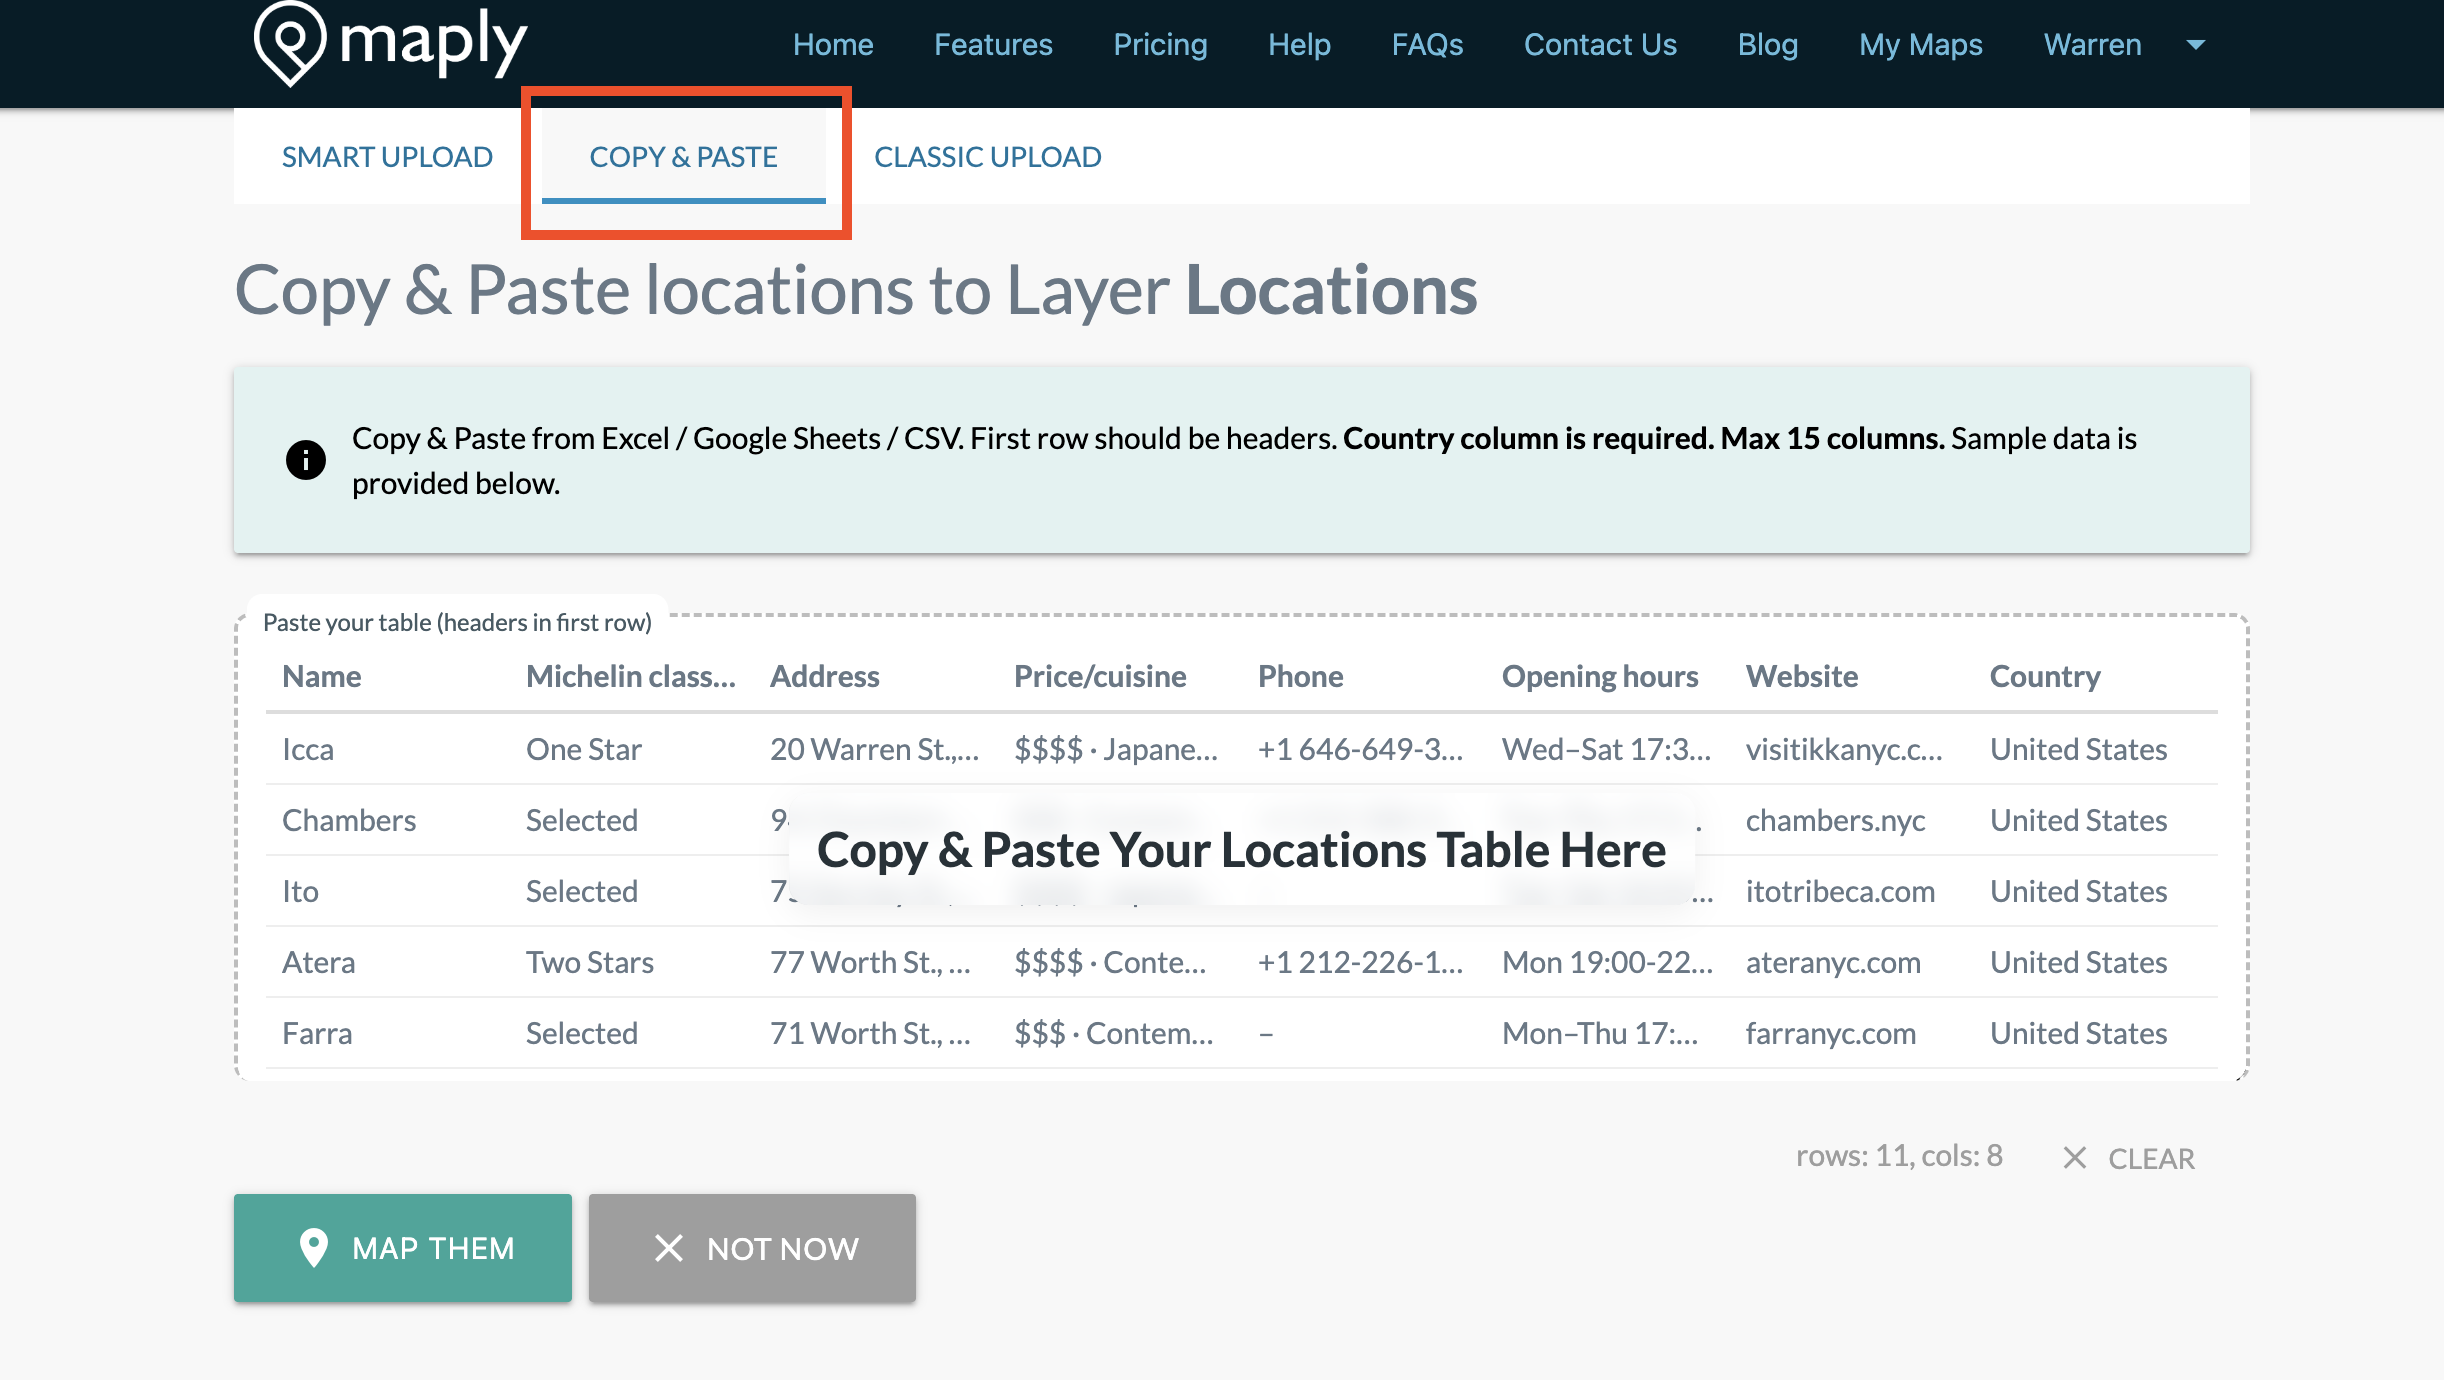
Copy & Paste is located to the right of the Smart Upload, when you upload data to a location map. It is an alternative to uploading your data using Smart Upload or Classic Upload.
With Copy & Paste, there’s no need to download or upload an Excel file anymore. Simply copy your data straight from a spreadsheet — like Google Sheets or Excel — and paste it straight into Maply. Quick, seamless, and ready to map in seconds.
Copy & Paste is quick and easy, but do still remember to follow the guidelines:
- Header Naming Matters
Column headers are used to identify and classify your data. Use clear and relevant names for best upload results. The first row of your data should be the headers, format it before pasting it into Maply. - Country Column Required
Your upload must include a country column. Without it, the upload will be rejected. - Column Limit
A maximum of 15 columns is allowed per upload. Please remove any excess columns before uploading.
Classic Upload
With Classic Upload, a proven way of uploading locations, a Maply template need to be used. Below is a tempate available for you to upload your data into Maply location map layers. If you are new to this, we recommend you to try Smart Upload, a much easier way to upload your locations.
Location Layer Excel template with sample data – with weight and remarks
Structure/format of Maply Location Upload Template
| No. | Column | Description | Optional/Required |
|---|---|---|---|
| A | Name | Name of the location. Will be used as display label for this location when avaiable. | Optional. This column should NOT be deleted from the upload template. |
| B | Address | Address of the location. | Optional. This column should NOT be deleted from the upload template. |
| C | Postal Code | Postal code of the location. | Optional. This column should NOT be deleted from the upload template. |
| D | Country | Country of the location. | Required. This column should NOT be deleted from the upload template. |
| E | Latitude | Sometimes referred as Lat, this is the latitude of the location. It ranges from -90 to 90. When Lat and Lng are provided, address information will not be used for geocoding. Note that usage limits apply. Refer to pricing page for more details. | This column is optional and can be omitted from upload template (as in the simple template above). |
| F | Longitude | Sometimes referred as Lng, this is the longitude of the location. It ranges from -180 to 180. When Lat and Lng are provided, address information will not be used for geocoding. Note that usage limits apply. Refer to pricing page for more details. | This column is optional and can be omitted from upload template (as in the simple template above). |
| G | Weight | A measurement associated to this location, e.g. number of people, price, number of orders, quantity, sales, etc. This is taken into consideration for icon size, heat map view display, and cluster view display. Weight is also used during COG calculation. | This column is optional and can be omitted from upload template (as in the simple template above). |
| H | Remarks | A short description of this location. You can use this field for contact information, such as contact person name, email, phone number, etc. All links and email addresses in this field will be displayed as hyperlinks and clickable on the popup window of that location on the map. | This column is optional and can be omitted from upload template (as in the simple template above). |
Important Note
While you are free to change the contents of the template, including the headers, and leave the optional column empty, it’s important NOT to delete any columns in the template. Otherwise, the upload may not work as expected.
If you have difficulties following the template, we recommend you try Smart Upload, a much easier way to upload your locations.
Location Layer Menu
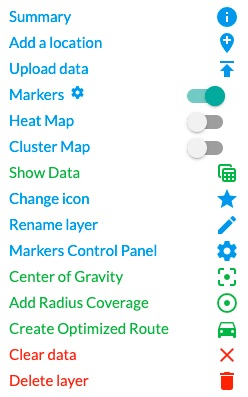
Once a location layer is added, there are a few things you can do at layer level, which is shown on the menu which will show up when the icon next to the layer name is clicked. See screenshot below.
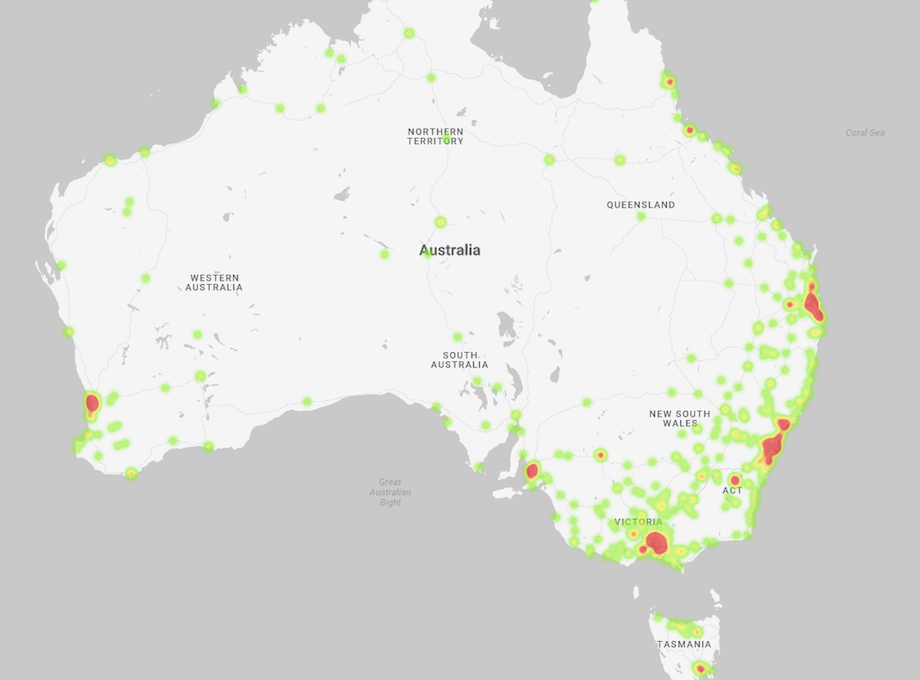
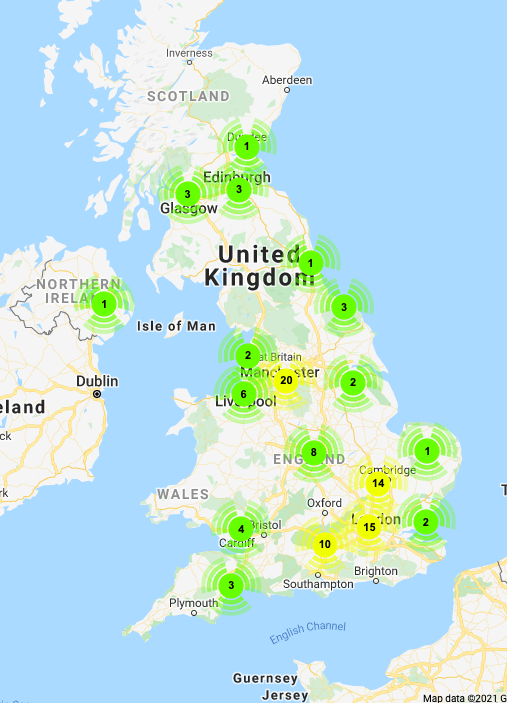
Heat Map and Cluster Map
From location layer, you can switch easily among location view, Heat Map view and Cluster Map view from the location layer menu.
Due to user experience, marker view will be disabled when number of locations exceeds 5000. If you need marker view for more than 5000 locations, you can convert the location map to a Hyper Location Layer.
Multiple Layers on a map
You can also add multiple location layers, with each layer a different group of locations. You can also make the icons of each layer different so that they are easily differentiated from each other on the map.
Center of Gravity, Route Optimization and Radius Converage
Once locations have been added to your location layer, you can calculate the Center of Gravity of those locations. You can also create an optimal route that visits all the locations in the shortest time or add a Radius Coverage Map.
Location Map Layer Capacity
A standard location layer can hold up to 50,000 locations. For datasets exceeds this limit, Hyper Location Layer can easily handle up to half a million locations on a single layer.