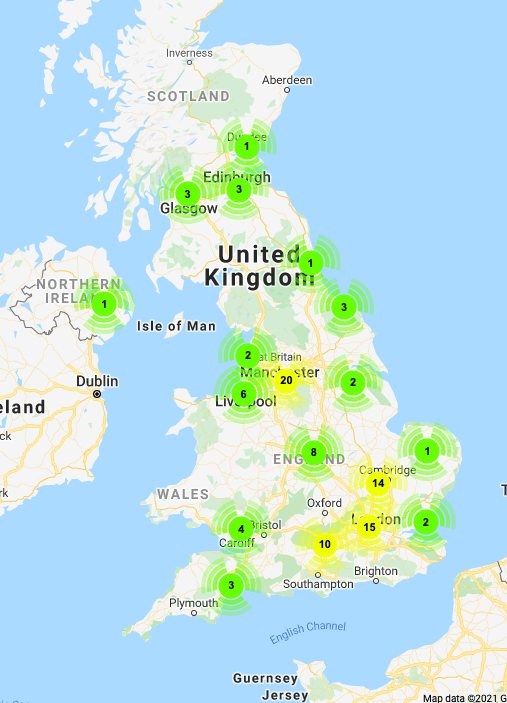
A cluster map automatically groups nearby map markers into a single icon when they are too close together to display individually. Each cluster shows the number of locations — or their combined weight — giving you a clean, readable map regardless of how many data points you have.
Cluster maps are especially useful when plotting hundreds or thousands of locations such as customer addresses, store locations, or field assets across a region.
Cluster map, as well as heat map, is part of the location layer. Once a location map is created, you can easily switch it to Cluster view.
Why use cluster view?
Displaying thousands of individual markers on a map creates two problems: the map becomes visually cluttered and performance degrades as you zoom in and out. Cluster view solves both.
- Cleaner map — nearby markers are grouped into a single cluster icon, removing visual noise
- Better performance — only clusters visible in the current viewport are rendered, keeping the map fast even with large datasets
- At-a-glance density — cluster icons are colour-coded from green (low density) to red (high density), so you can immediately see where your locations are concentrated
How cluster maps work in Maply
Maply divides the map into a grid and groups locations that fall within the same grid section into a single cluster. As you zoom in, clusters break apart into smaller clusters or individual markers. Clicking a cluster zooms the map in to reveal what’s inside.
Colour coding by density
Cluster icons use a 10-step colour gradient — bright green for sparse clusters through to red for the densest ones — making hotspots instantly visible without needing to read any numbers.
Supports large datasets
- Standard location layers: up to 5,000 locations
- Large dataset layers (HyperLocation): up to 500,000 locations
Weighted cluster maps
Maply supports weighted clustering. When your locations have a numeric value or weight attached — such as sales revenue, visitor count, or inventory volume — each cluster displays the sum of weights for the locations it contains rather than a plain count.
Large totals are displayed in shorthand (e.g. 12K, 3.5M) so they remain readable at any zoom level. Cluster colour intensity also reflects the total weight, not just the number of locations.
To use weighted clusters, import your data using the Location Layer Excel template (Advanced — with weight and remarks). Weights can be viewed and edited at any time under the “Show Data” page.
The GIF below shows how you can switch between different views and see the immediate effect.
Switch between views instantly
Cluster map is one of several views available within a location layer. You can toggle between views without recreating your map:
- Marker view — individual pins for each location
- Cluster view — grouped markers with counts or weights (this page)
- Heat map — density gradient showing concentration areas
- Hexagon map — hexagonal binning for pattern analysis (only available on hyper location layers)
All views can be enabled simultaneously — for example, displaying a heat map and cluster view at the same time on the same layer.
How to create a cluster map
- Create a Location Map by importing your location data
- Open the layer settings panel
- Toggle Cluster Map on
That’s it. Maply builds the clusters automatically. The setting is saved so cluster view is the default the next time you open your map.
Pro Tip
Maply supports weighted cluster maps. If there are weight applied to the locations, sum of weights of clustered locations is displayed. To create weighted heat maps, a numeric column is required in the uploaded data. Please refer to Location Layer Excel template (Advanced – with weight and remarks) for an example. The weight of locations can be viewed and changed under “Show Data” page.