Mapping tools and features by Maply

Maply is an intuitive online mapping app designed for visualizing and analyzing geospatial data. Transform your location data into clear, easy-to-understand visuals, gaining deeper insights and uncovering hidden value.

With a wide array of mapping tools and features, Maply empowers you to explore and interpret your data like never before.
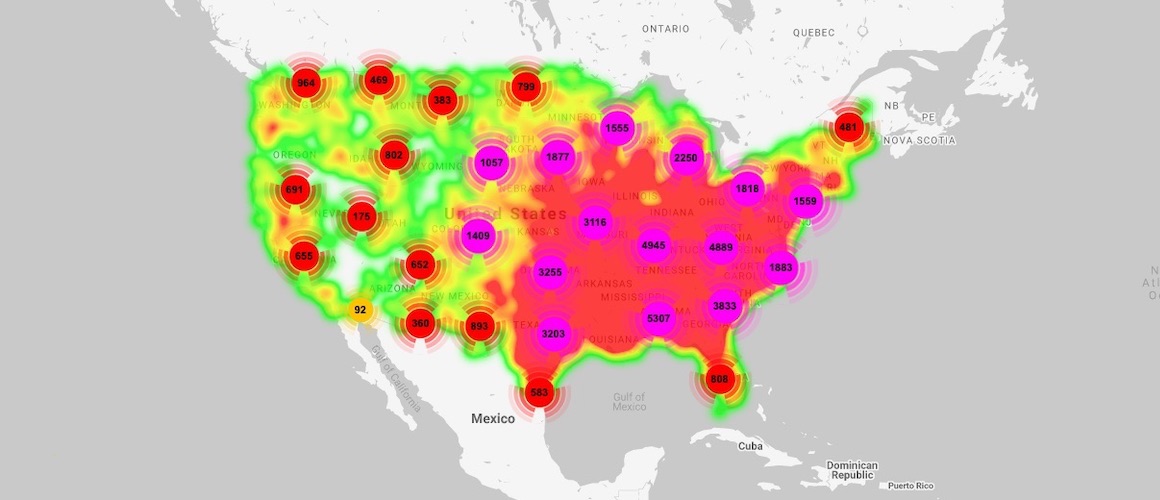
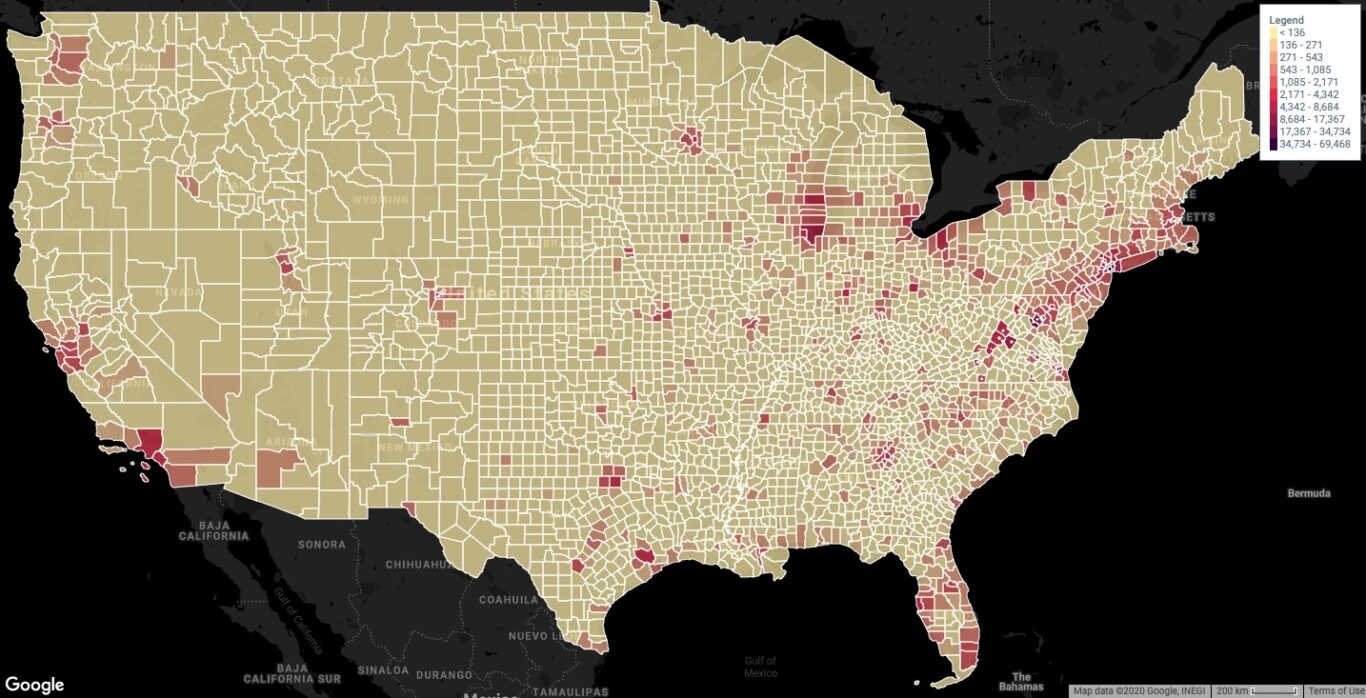
Geographic heat map

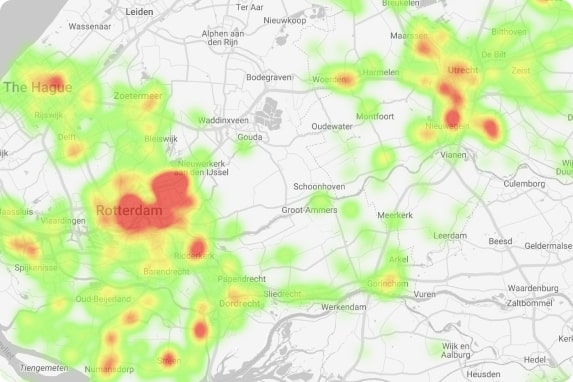
A Geographic Heat Map, or heatmap, represents different densities of data points on a geographical map, allowing you to visualize the intensities of certain phenomena. By using various colors and gradations, it provides immediate visual insights into the areas with the highest activity or interest.

geographic heat map by Maply

geographic center of gravity analysis

Center of Gravity (CoG)

Given a list of locations, Maply can identify the geographic Center of Gravity (CoG), a point where the sum of weight distances to each location is minimized, to support decision making on site selection.


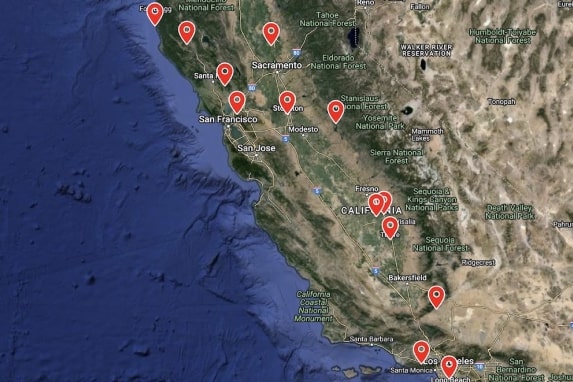
Location Map

Location map is the most common type of maps. Very often, the starting point for visualizing addresses or zip codes is to put them on the map.

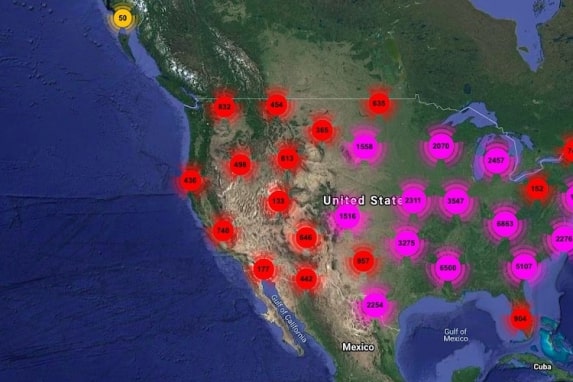
Cluster Map

When there are too many locations on the map, they will all cluster together and the map gets messy. In this case, a cluster map comes in handy.

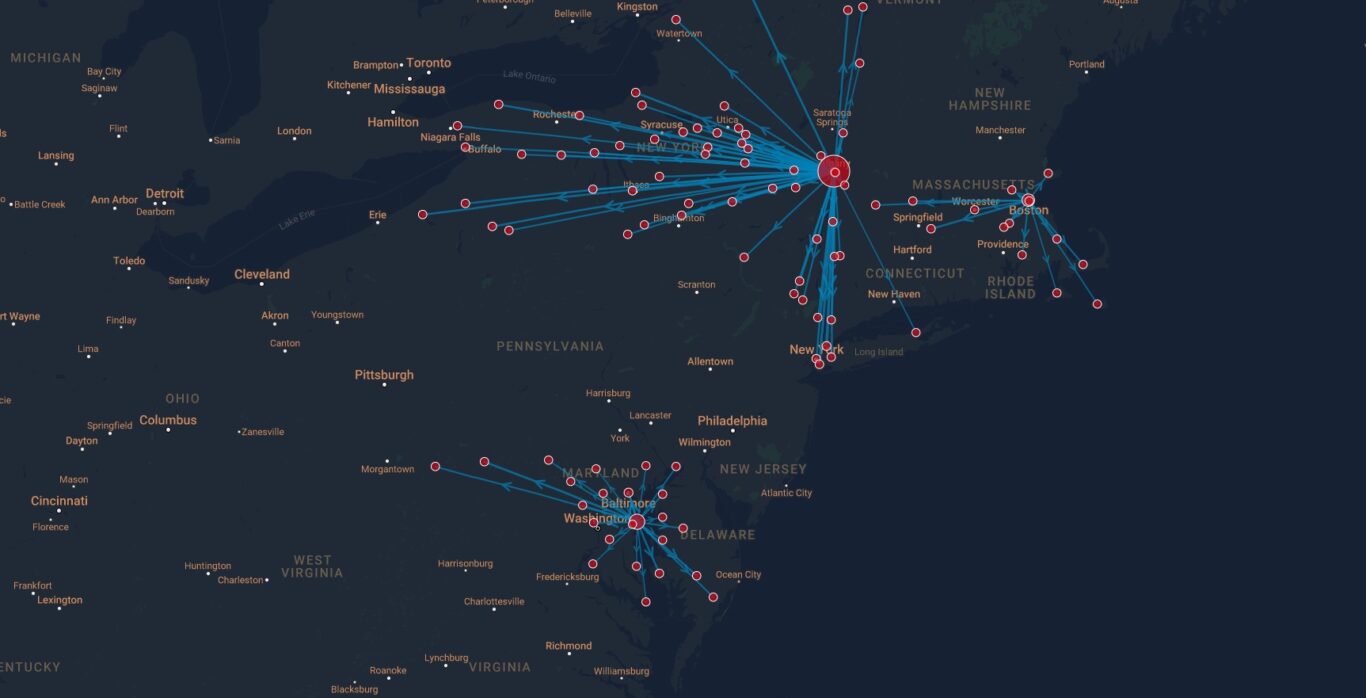
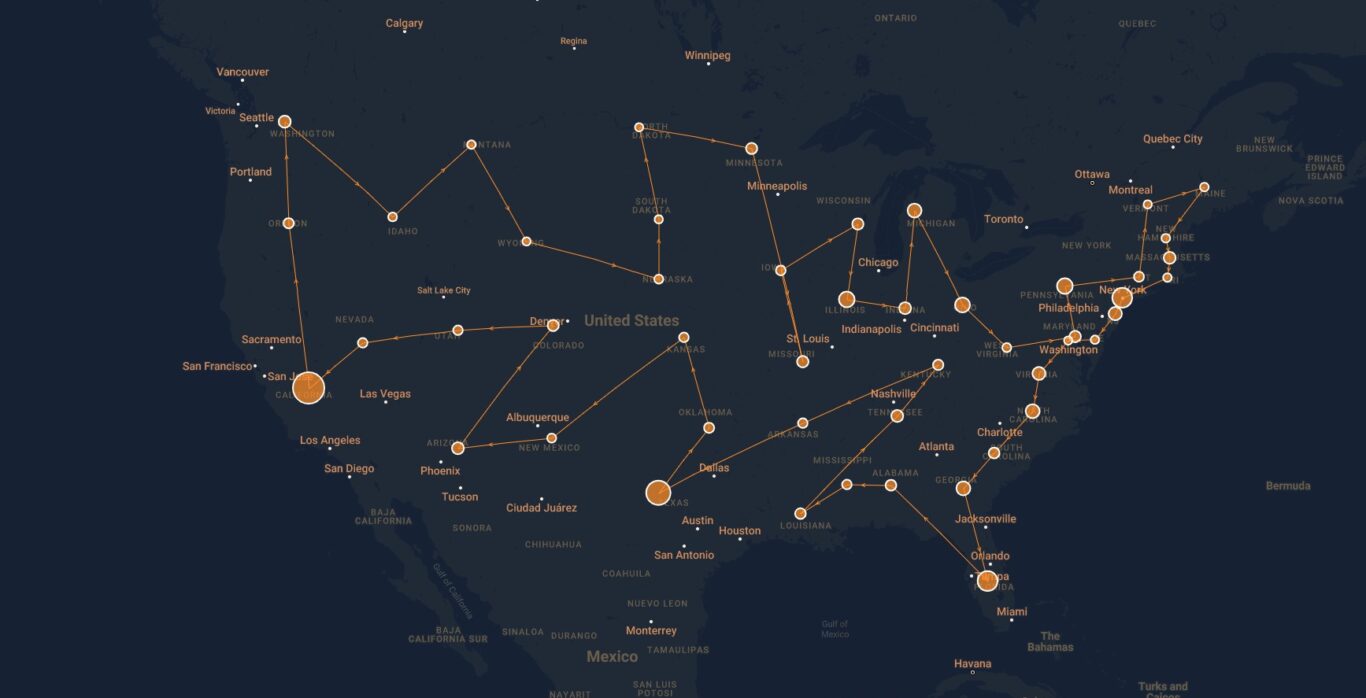
Network Map

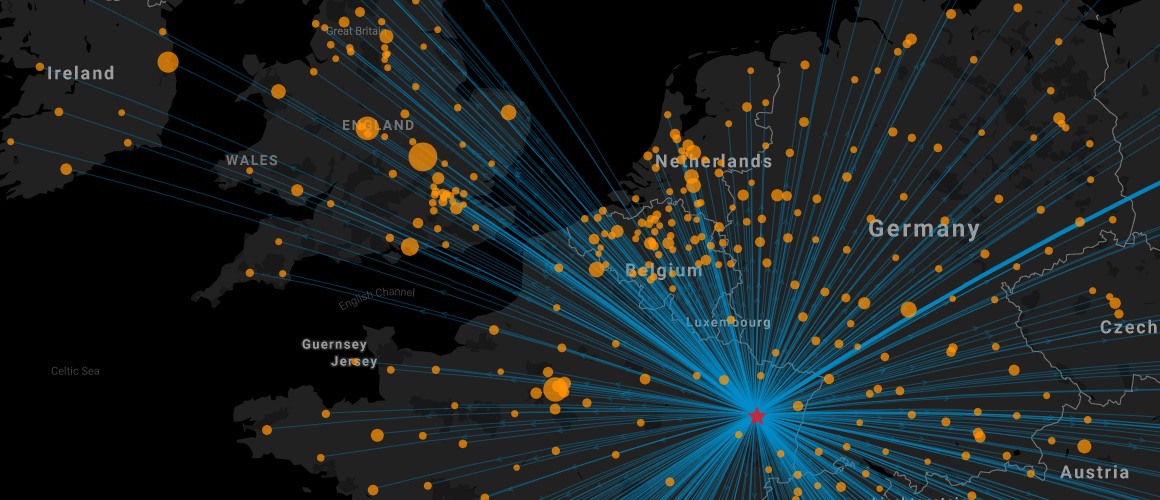
Network map is a powerful tool to visualize supply chain flows, airline operations, trucking operations and logistics coverage. It is a unique feature of Maply that is not available from most other mapping solutions.

Radius/Bubble Map

Radius coverage map is a powerful tool, which can reveal which areas are under-served and which areas are over-served. This information is very valuable for new openings for retail stores, restaurants, offices, schools, clinics, repair shops, etc.

Zip/Postal Code Analytics

Have a list of postal codes with you and wondering how they are distributed geographically? You can easily visualize them on the map with Maply.

Territory map

A territory map, or choropleth map, shades or patterns areas like countries, states, or zip codes based on a measurement representing a geographic characteristic, such as population density or per-capita income.

Route Optimization

Visiting multiple locations and want to know how to do this in the most time and fuel saving route? No problem. Maply can help you to calculate the most efficient driving route for up to 50 locations.

Batch Driving Distance

Using Network Maps on Maply, you can get driving distances and times between multiple location points in one go, saving you time searching Google Maps one by one. Get support for your decision making facility planning.

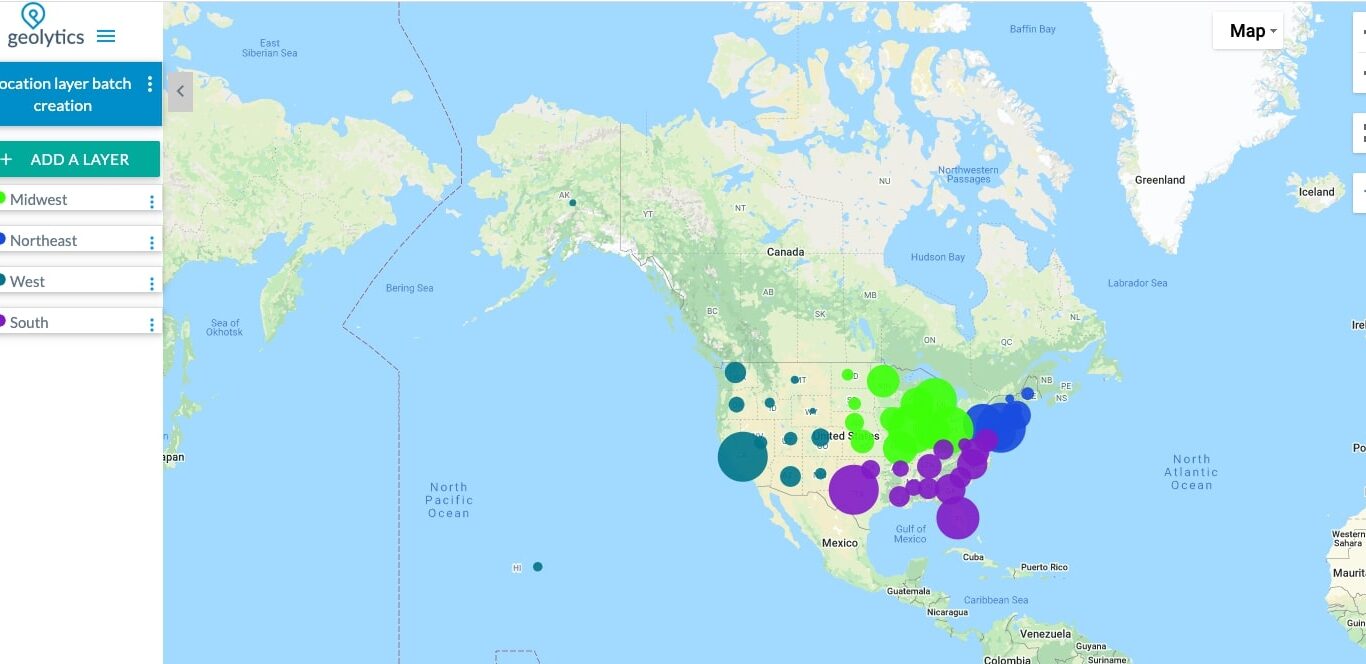
Location Layer Batch Creation

Creating a location layer takes a couple of steps. But when you need to create many location layers, say more than 10, you start to wonder if there an even faster way, to avoid all the repetitive clicks. Maply has you covered with Location Layer Batch Creation.

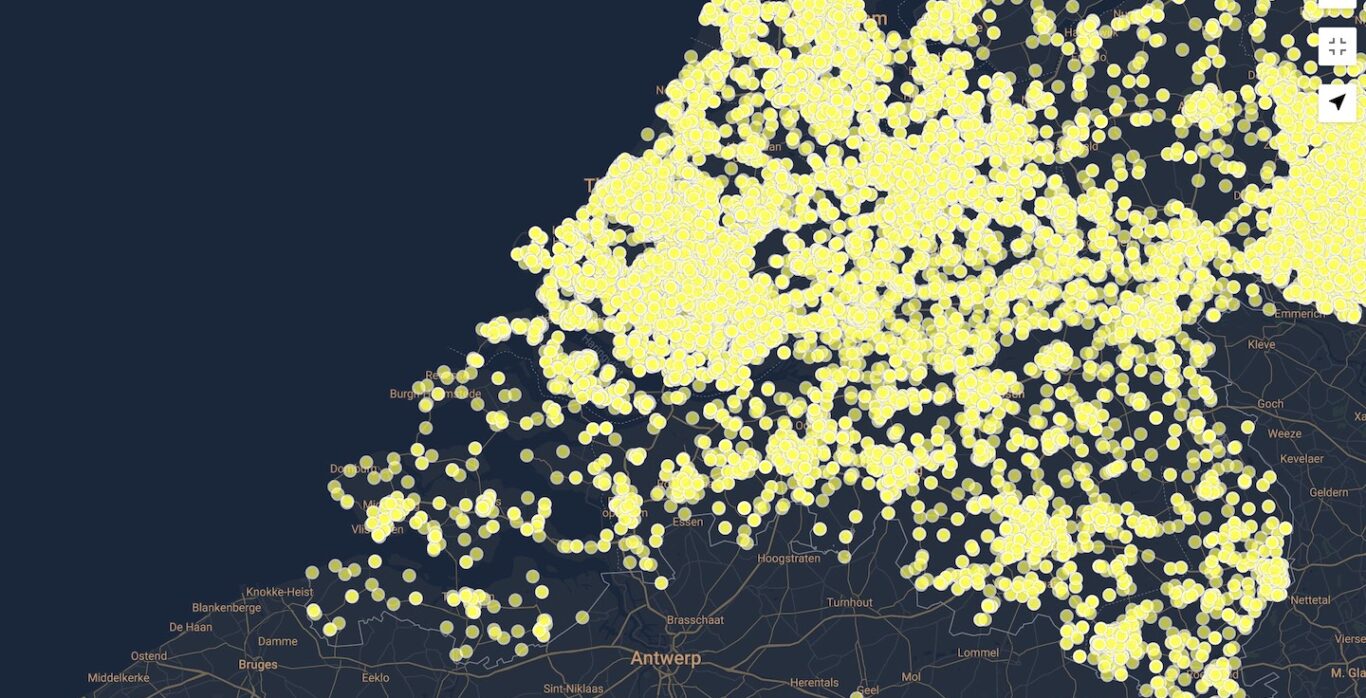
Hyper Location Map

The Hyper Location Map is designed for visualizing datasets exceeding 5,000 locations. Unlike a standard location layer, the Hyper Location map efficiently displays tens of thousands of individual pins with optimal performance.

play_arrowFree Sign up

No credit card is required

Cookies help us deliver our services. By using our services, you agree to our use of cookies. Learn more