What is a Geographic Heat Map?
A Geographic Heat Map, or heatmap, represents different densities of data points on a geographical map, allowing you to visualize the intensities of certain phenomena. By using various colors and gradations, it provides immediate visual insights into the areas with the highest activity or interest.
According to Wikipedia, the term ‘heat map’ was coined and trademarked by software designer Cormac Kinney in 1991 to describe a 2D display depicting financial market information, though similar plots, such as shading matrices, have existed for over a century.
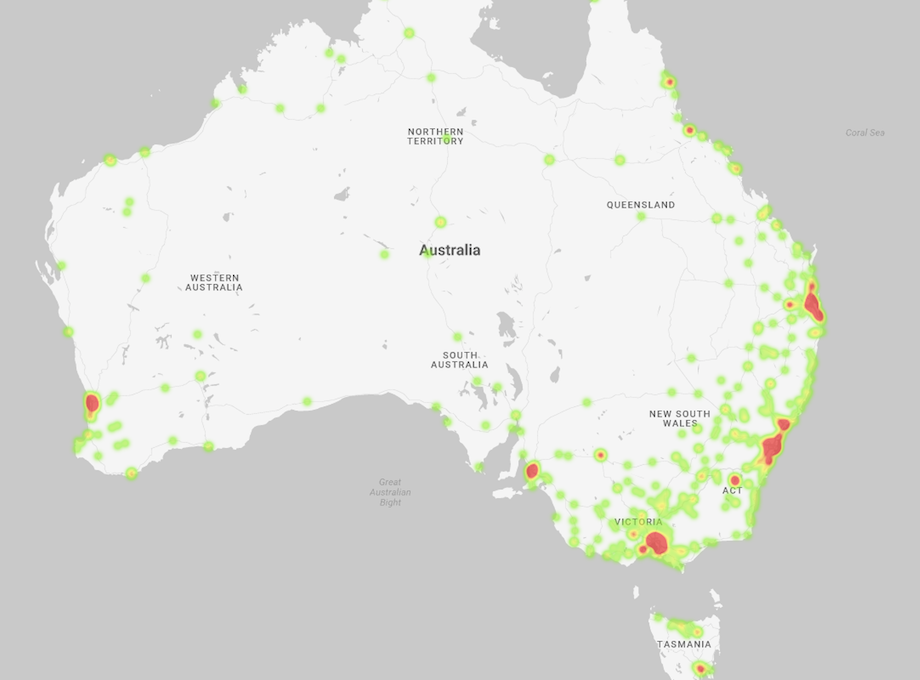
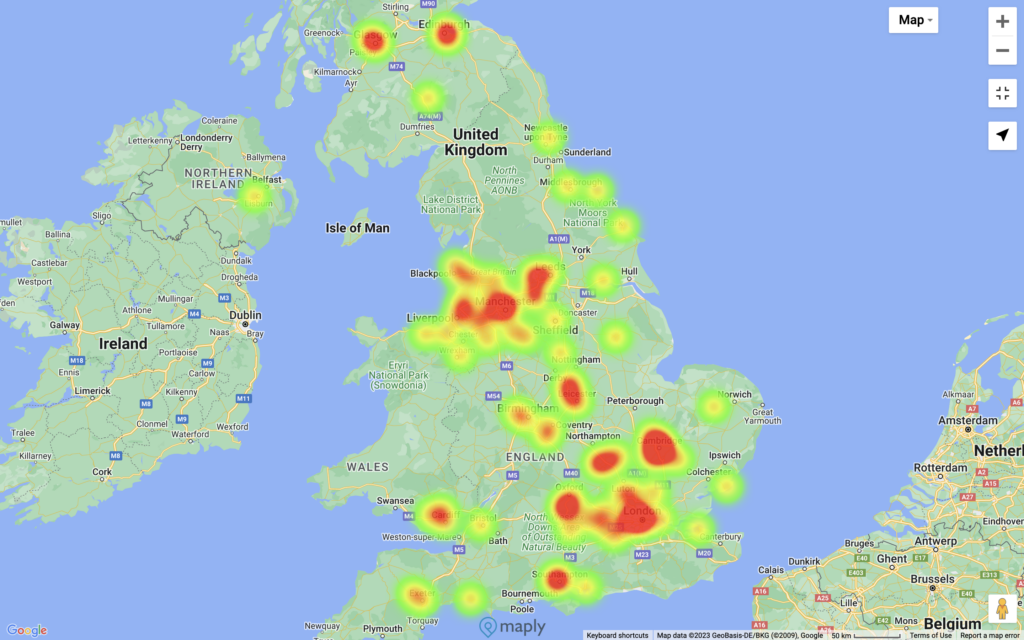
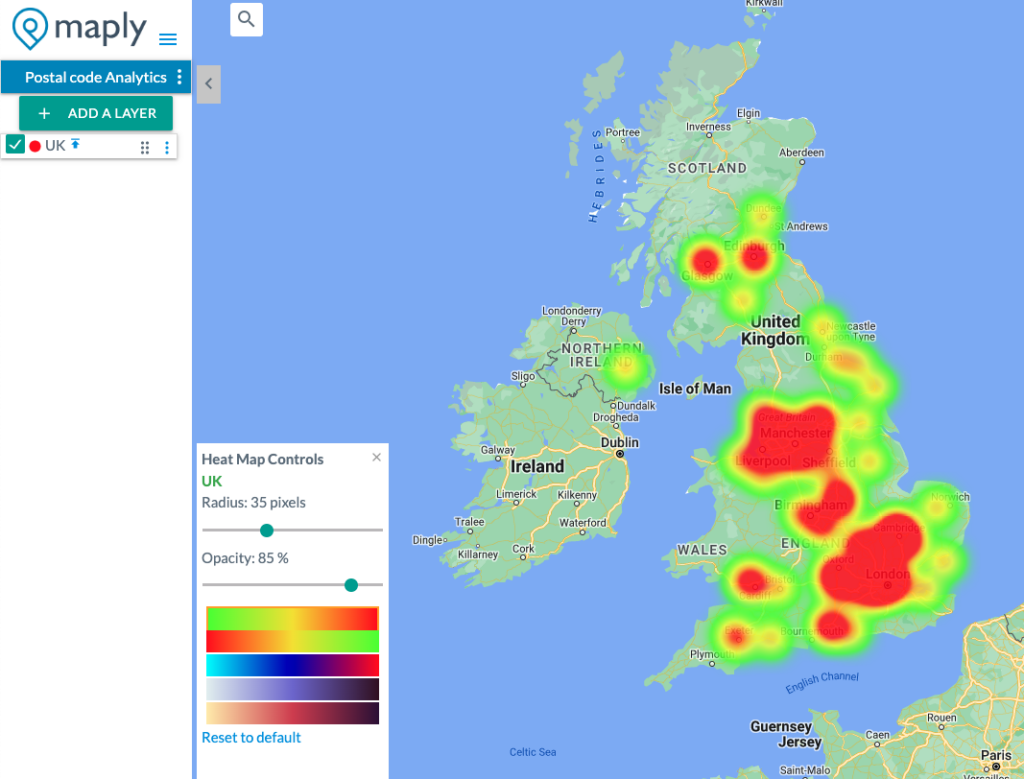
Below are two examples of geographic heat maps created using Maply.
Why Create a Geographic Heat Map?
Geographic Heat Maps are powerful visualization tools that represent data concentration across various regions, areas, and locations. Here are two major benefits of using this tool:
- Visual Simplicity and Directness: One of the standout benefits of a geographical heat map is its ability to communicate complex data in an easy-to-understand format. This makes it accessible to everyone, regardless of their data literacy levels. The ease of comprehension makes a heat map an excellent tool for building consensus among diverse groups, as it presents clear, visually compelling evidence that can persuade an audience.
- Decision-Making Support: This tool is particularly beneficial in supporting decision-making for site selection. Whether you’re considering the placement of new stores, restaurants, clinics, transport hubs, distribution centers, offices, or shopping malls, a geographical heat map can guide you toward the areas with the most potential.
How to Create a Heat Map?
Creating a heat map in Maply is simple and straightforward. Just follow the steps here:
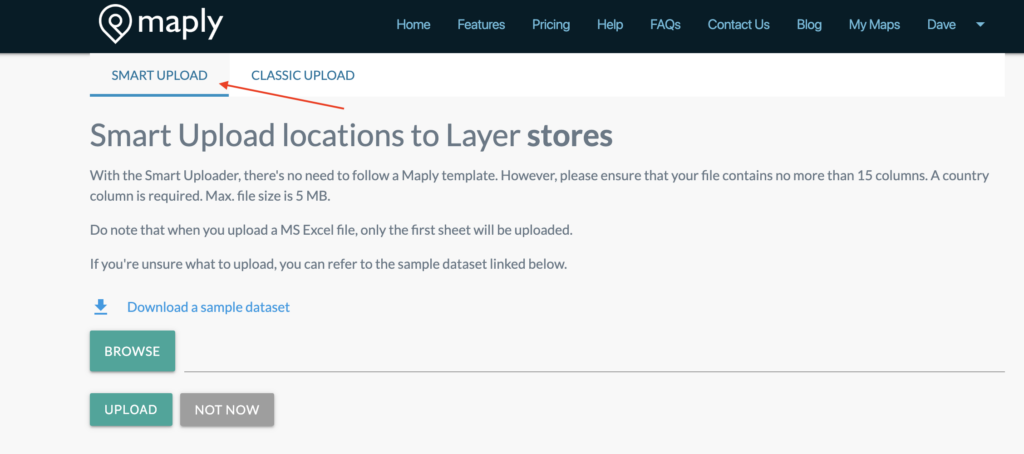
- Register for a free Maply account if you don’t have one yet.
- Log into Maply and go to “My Maps” and add a new map.
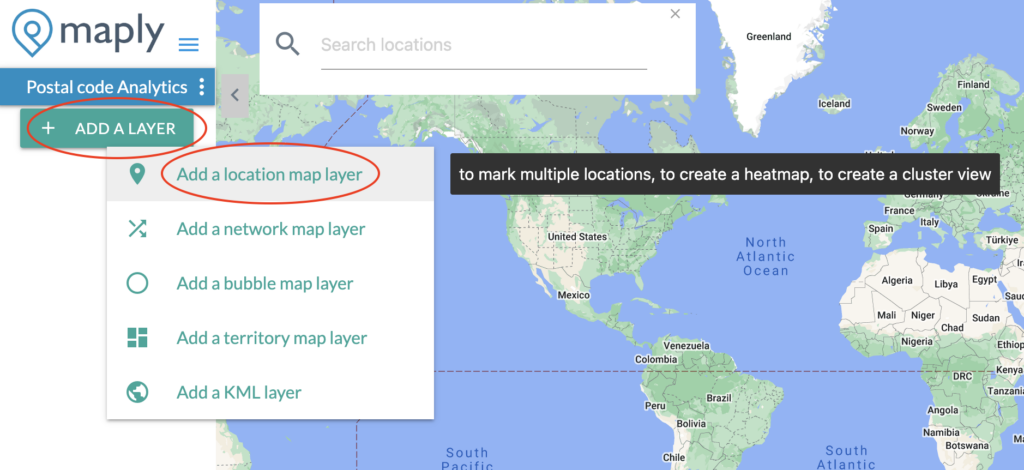
- Go to your newly added map and add a Location Layer.
- Switch on the heat map view.

- Voilà! Your geographic heat map is created.
The heat map feature is available automatically for every location map. Once a location map is created, you can easily switch between different views to get new perspectives.
Pro Tip
Maply supports weighted heat maps. When weights are unavailable, each location will have a weight of 1. Applying a weight to a data point will cause the location to be rendered with a different intensity. The weight is a linear scale. Having a weight of 3, for example, is equivalent to having three data points at the location.
To generate weighted heat maps, your dataset must include a numeric column—such as sales, profit, shipment count, or any other meaningful value linked to each location.
Watch the video tutorial
You may also watch the video tutorial here if you want a more visual explanation!
Heat Map Controls
Maply gives you finer controls on the look and feel of your heat maps through a control panel. You can adjust the radius, opacity and color gradient schemes to suit your needs.
Other Types of Heat Maps Available on Maply
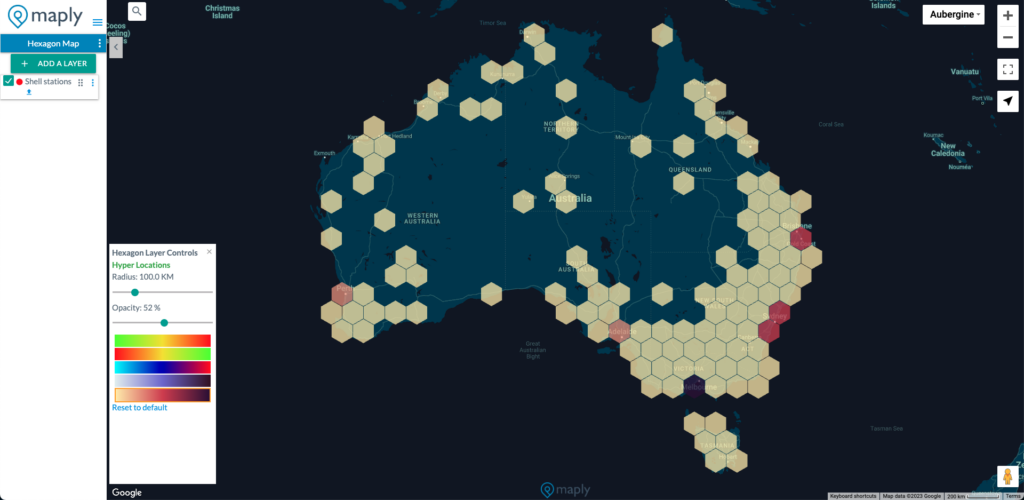
Hexagon Heat Map
A Hexagonal Heat Map uses hexagons of equal size and shape to present geospatial data. This structure provides a visually appealing and effective method for interpreting complex spatial information.
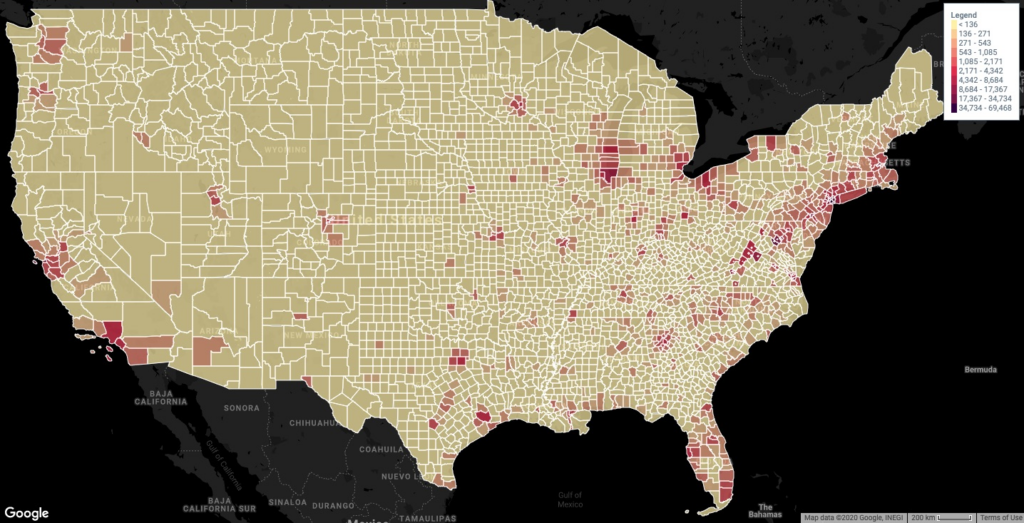
Territory Heat Map
Also known as a choropleth map, a territory heat map shades or patterns areas (such as countries, states, provinces, counties, cities, districts, or zip codes) in proportion to a measurement representing a geographical characteristic, like population density or per-capita income.
By understanding and utilizing these various types of heat maps, you can leverage Maply’s capabilities to gain deeper insights and make informed decisions based on geospatial data.
Ready to Create Your First Geographic Heat Map?
After following this guide, you’ll see how easy it is to use Maply as a heat map generator. Now, it’s time to get hands-on and start creating your own!