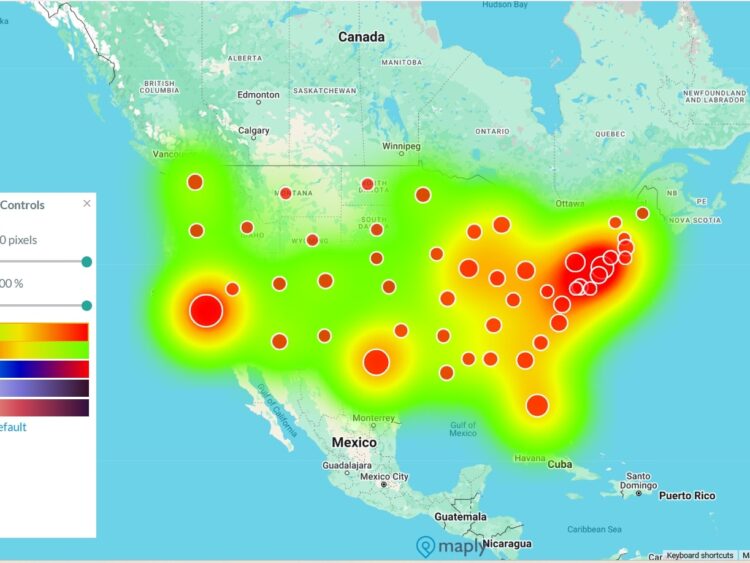
A Geographic Heat Map, or heatmap, represents different densities of data points on a geographical map, allowing you to visualize the intensities of certain phenomena. By using various colors and gradations, it provides immediate visual insights into the areas with the highest activity or interest. According to Wikipedia, the term ‘heat map’ was coined and […]